Manufacturing Cost Tracking Skills and Margin Analysis for Better Product Profitability Decisions


TL;DR
At iProledge, we see that working manufacturing professionals need more than cost-accounting theory: they need visibility into material, labor, overhead, and data sources. This guide shows how to build manufacturing cost tracking skills, create a product-margin workbook, fix weak inputs, and practise the work through a four-week plan.
Cost analysis matters because product pricing, purchasing, production, and investment decisions all depend on it. In the United States, cost estimators held about 221,400 jobs in 2024, with manufacturing accounting for 12% of employment in the occupation, according to BLS data.
The missing skillset is manufacturing cost tracking skills: the ability to trace materials, labor, and overhead; choose defensible cost drivers; separate gross from contribution margin; explain variances; and turn ERP exports into a reconciled model. We teach this as a connected workflow because no single calculation can explain whether a product line really improves profitability.
In this guide, we show what to fix before building a model, the five capabilities to develop, an Excel structure to use, and a four-week practice plan for working professionals. Our skills gap plan adds a complementary route for turning the framework into workplace practice.
Fix the Data Infrastructure Before Building Manufacturing Cost Tracking Skills
A margin analysis can be mathematically correct and still be operationally useless. If material use is missing from the BOM, labor hours are not tied to a product or work order, or overhead is assigned through an undocumented rule, the workbook will only make unreliable inputs look more polished.
Start by mapping each data source and naming its owner. You need a current product master, BOMs with consistent units of measure, actual purchase or issue costs, labor or routing records, production quantities, overhead accounts, and net revenue by SKU or product line. The most reliable estimates begin with actual, traceable data and documented assumptions, a discipline emphasised in the GAO cost guide.
Before trying to learn another formula, test whether you can answer these questions for one product: Which system owns the data? What period does it cover? Does the product code match across systems? Who can explain a missing value? If those answers are unclear, improving the data process is the first project.
Our 30-day Excel crash course can help turn that audit into a practical learning routine. The goal is not perfect data on day one. It is a transparent model where missing data, assumptions, and reconciliation gaps are visible before management relies on the result.
The Five Manufacturing Cost Tracking Skills That Matter Most
The strongest analysts connect factory activity to a financial decision. They do not merely report a total cost or a percentage, because management needs to know what moved, why it moved, and which team can investigate it.
| Skill | What It Lets You Answer | Core Practice |
|---|---|---|
| Cost Visibility | What did this product actually consume? | Trace materials, labor, and overhead |
| Cost Allocation | How should shared factory cost reach products? | Select and document drivers |
| Margin Analysis | Which products create value at different cost levels? | Compare gross and contribution margin |
| Variance Analysis | What changed versus plan or standard? | Separate price, rate, and efficiency effects |
| Data Literacy | Can the report be repeated and trusted? | Extract, reconcile, model, and explain |
Build Cost Visibility and Cost Allocation Judgment
Cost visibility begins with three product-cost categories: direct materials, direct labor, and manufacturing overhead. Manufacturing overhead includes production costs that cannot be economically traced to one unit, such as supervision, maintenance, utilities, indirect materials, or factory depreciation.
- Trace direct inputs: Link materials and labor to a SKU, job, batch, or routing where practical.
- Classify indirect cost: Keep shared factory cost separate from sales and administrative expense.
- Choose a driver: Test machine hours, labor hours, setups, inspections, or purchase orders against the cost pool.
- Document the rule: Record the allocation method, rate, owner, and review date.
A cost driver should make operational sense before it makes a spreadsheet look tidy. A labor-hour driver can be reasonable in a labor-intensive operation, while machine hours or setups may better reflect cost in an automated plant. Formal management accounting paths can help build the judgment required to explain that choice, not simply calculate it.
Analyse Gross Margin and Contribution Margin Separately
Gross margin tells you what remains after cost of goods sold. Contribution margin tells you what remains after variable costs, showing the amount available to cover fixed costs and profit. The two measures answer different management questions, which is why they should sit side by side rather than compete for one “correct” margin number.
- Calculate gross profit: Revenue minus full COGS, including allocated manufacturing overhead.
- Calculate gross margin: Gross profit divided by revenue.
- Calculate contribution margin: Revenue minus all variable costs relevant to the decision.
- Rank thoughtfully: Review both margin percentage and total margin contribution.
Contribution margin is especially useful when sales volume, capacity, or a short-run order is under discussion. It shows the contribution from each sale toward fixed costs and profit, as explained by OpenStax guidance.
Use Variance Analysis to Start Investigation
Variance analysis compares actual cost with the standard cost allowed for actual output. It is not a verdict on a department or employee. It is the first signal that a purchasing, quality, scheduling, labor, engineering, or data issue may need closer attention.
- Material price variance: Did the unit price paid differ from the standard?
- Material usage variance: Did production consume more or less material than expected?
- Labor rate variance: Did the hourly labor rate differ from standard?
- Labor efficiency variance: Did actual hours differ from the hours allowed for output?
An unfavorable material variance might indicate higher supplier pricing, excess scrap, an inaccurate BOM, or a unit-of-measure error. Investigate the cause before recommending an action. Standard-versus-actual analysis is designed to prompt that investigation, according to the variance framework.
Turn ERP Exports into a Reproducible Model
Data literacy is the skill that makes the other four usable. You need to extract the right fields, preserve source references, reconcile totals, and make assumptions visible to the next person who opens the file.
- Extract consistently: Pull the same period, entity, currency, and SKU level each time.
- Use audit-friendly formulas: Apply SUMIFS, lookups, PivotTables, and checks instead of manual totals.
- Reconcile before reporting: Tie product totals back to source-system revenue and cost totals.
- Explain the result: Write the variance driver, owner, and next action in plain language.
These habits are valuable in both finance and operational roles. Explore cost analyst pathways if you want to see how this capability can connect to broader manufacturing career progression.
Build a Product Margin Analysis Workbook
A good workbook should be simple enough to refresh, yet detailed enough to show why a margin changed. We recommend starting at the SKU or product-line level, then rolling upward only after the lowest practical reporting grain reconciles.
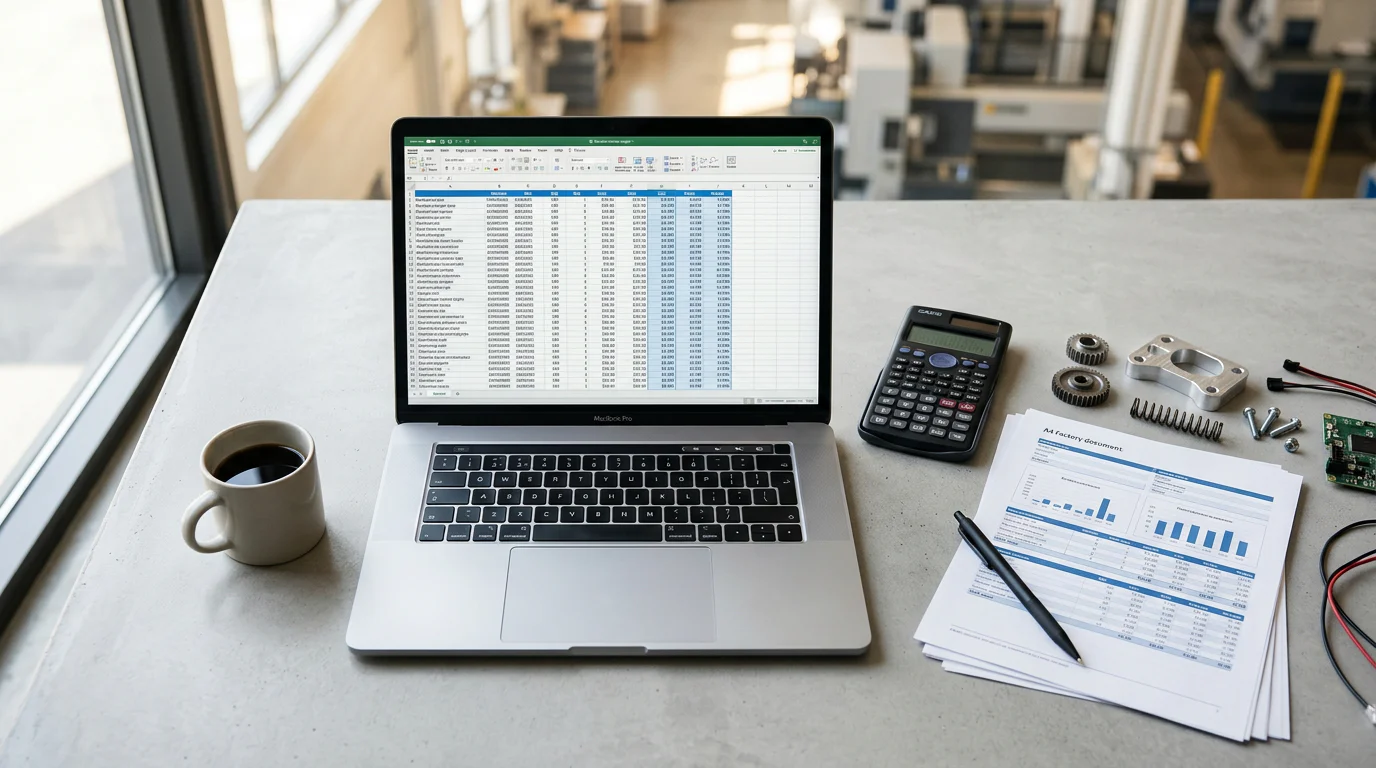
Use These Columns in the Core Table
| Column | Purpose | Formula Or Control |
|---|---|---|
| Product/SKU And Product Line | Defines the reporting grain | Validate against the product master |
| Period And Units Sold | Connects sales and production activity | Reconcile to source reports |
| Revenue | Captures net sales | Sum invoice or revenue extract |
| Direct Materials | Tracks material cost | BOM quantity × unit cost |
| Direct Labor | Tracks production labor | Hours × labor rate |
| Variable Overhead | Captures volume-sensitive factory cost | Driver usage × variable rate |
| Fixed Overhead Allocated | Supports full-cost reporting | Driver usage × fixed rate |
| COGS | Shows full manufacturing cost | Materials + labor + overhead |
| Gross Profit And Margin | Measures full-cost product profitability | Revenue − COGS; gross profit ÷ revenue |
| Selling Variable Costs | Supports contribution analysis | Freight, commission, or similar costs |
| Contribution Margin And % | Shows short-run contribution | Revenue − all variable costs; contribution margin ÷ revenue |
| Variance Explanation | Turns output into action | Record cause, owner, and next check |
Keep allocated fixed overhead visible. When a report hides it inside one unexplained COGS figure, readers cannot tell whether a margin change came from materials, labor, volume, or an allocation assumption. For external financial reporting, COGS commonly includes direct materials, labor, and allocable factory overhead, as outlined in IRS guidance.
Add Controls Before Adding Charts
First, build a reconciliation row: total workbook revenue should match the revenue extract, and total cost should match the selected accounting source after documented exclusions. Then add exception checks for missing BOM cost, zero production volume, unmatched product codes, and unexplained overhead.
For each SKU, display actual and standard cost separately. That lets you distinguish a margin decline caused by a real price increase from one caused by a stale standard cost. A concise comments field should identify the variance driver, the responsible team, and the next date for review.
The model can also help you decide which formal qualification route best matches your work. Compare cost analysis roles when you need to connect day-to-day product costing with longer-term management accounting responsibilities.
Follow a 30-Day Learning Plan While Working Full-Time
The fastest way to make this skillset practical is to learn one part of the workflow each week and apply it to a real or realistic product. Keep the deliverables small enough to finish, because a completed reconciled workbook teaches more than a large unfinished model.
| Week | Learning Goal | Practice Exercise | Deliverable |
|---|---|---|---|
| Week 1 | Define costs and map data sources | Trace one SKU from BOM to revenue | Data map with missing fields highlighted |
| Week 2 | Learn cost pools and allocation methods | Compare labor-hour and machine-hour allocation | Documented overhead method |
| Week 3 | Build gross and contribution margin views | Calculate margins for three products | Reconciled product-margin table |
| Week 4 | Analyse variances and report actions | Investigate one material or labor variance | One-page management report |
Set aside three focused sessions of 45 to 60 minutes each week. In week one, do not start with complicated formulas. Learn where each number originates and what it means. In week two, test whether the allocation basis changes the story for different products. In week three, reconcile the model. In week four, write the explanation management actually needs.
If you need structured support alongside this plan, review our available courses before committing to a study routine. The standard for every week is reproducibility: another person should be able to trace the figures, understand the method, and ask a useful follow-up question.
Build Your Cost Analysis Capability with iProledge
At iProledge, we help working finance and manufacturing professionals turn scattered accounting knowledge into decision-ready cost analysis. Our learning support is built for people who need to understand the numbers behind materials, labor, overhead, product margins, and operational variances while keeping up with a full-time role. We can help you identify which management accounting path fits your present experience, structure a practical study plan, and practise the Excel and reporting habits that make technical concepts usable at work. We also shape each plan around your working schedule, existing responsibilities, and access to real manufacturing data, so learning has a direct workplace application. That keeps development focused on decisions your manager can recognize and use. When you are ready to discuss your situation, questions, and next step, speak with iProledge
FAQs on Manufacturing Cost Tracking Skills
These questions cover the distinctions and practical decisions that most often determine whether a product-margin report helps management act.
What Is the Difference Between Gross Margin and Contribution Margin?
Gross margin deducts full cost of goods sold, including allocated manufacturing overhead. Contribution margin deducts variable costs only, showing what each sale contributes toward fixed costs and profit.
What Is a Cost Driver in Manufacturing?
A cost driver is an activity linked to spending, such as machine hours, setups, or inspections. Choose one that best reflects how the related cost pool changes.
What Does Variance Analysis Tell a Manufacturing Manager?
Variance analysis compares actual cost with the standard cost allowed for actual output. It separates price, rate, usage, and efficiency changes so managers can investigate the underlying cause.
How Do I Analyse Margin by Product Line?
Use consistent SKU revenue, volume, direct material, labor, and overhead data. Calculate margins by product, reconcile totals, then investigate meaningful movements before making product-line decisions.
What Should I Fix Before Trusting Product Margin Data?
Secure a reliable source export, current BOMs, complete labor capture, and a clear SKU mapping. Document ownership and refresh dates before trusting calculated product-margin results in decisions.