Manufacturing Cost Tracking and Margin Analysis: A 30-Day Skill-Building Plan for Finance Professionals
A 30-day plan for finance professionals to build manufacturing cost tracking and margin analysis skills with daily tasks and Excel templates.

By Naveen J D, Founder · Updated 11 Oct 2026

In brief
We built this 30-day plan for finance professionals who need to explain product costs and margins while working full-time. It develops cost visibility, overhead allocation, variance analysis, product-level reporting, and Excel-based margin decisions through daily tasks, practical templates, and a clear framework for gross, contribution, and operating margin.
In this article
- 1Week 1: Start Manufacturing Cost Tracking and Margin Analysis with Cost Visibility
- 2Week 2: Build Overhead Allocation Logic You Can Defend
- 3Days 8 to 9: Create Cost Pools
- 4Days 10 to 11: Match Each Pool to a Driver
- 5Days 12 to 14: Test and Document the Result
- 6Week 3: Turn Variances into Product Margin Decisions
- 7Days 15 to 16: Freeze a Comparable Standard
- 8Days 17 to 19: Split the Variance Before Explaining It
- 9Days 20 to 21: Build the Product P&L
- 10Week 4: Make the Process Repeatable in Excel
- 11Use Excel Templates to Explain Product Margin
- 12Build This Skill with iProledge
- 13FAQs on Manufacturing Cost Tracking and Margin Analysis
Cost discipline is no longer just a month-end concern. BLS data show US manufacturing unit labour costs increased 2.3% in 2025, even as manufacturing productivity rose 2.0%.
If you work full-time in manufacturing and cannot explain product cost or margin, the missing skills are cost visibility, allocation logic, variance interpretation, and margin decision-making. This manufacturing cost tracking and margin analysis plan builds those skills in 30 days by using one real product, its production data, and a decision-ready report.
We walk through four practical weeks, then show how to turn the work into Excel templates, a margin waterfall, and better conversations with management.
Week 1: Start Manufacturing Cost Tracking and Margin Analysis with Cost Visibility
The first week is about tracing one product through your company’s data, not trying to redesign the whole accounting system. Pick a representative SKU or product family, then use it as your learning case for all 30 days.
For inventory reporting, IAS 2 includes purchase costs, conversion costs such as direct labour and production overhead, and other costs needed to bring inventory to its current condition. Your first job is to see where each of those inputs actually originates.
- Day 1: Choose one SKU, plant or site, and reporting month.
- Day 2: Export the BOM, purchase-price history, production order, routing, inventory movements, and sales data.
- Day 3: Map every BOM line to quantity, unit price, scrap allowance, and source system.
- Day 4: Map production operations to setup time, run time, labour, machine, and indirect-cost categories.
- Day 5: Separate direct material, direct labour, manufacturing overhead, selling costs, and administrative costs.
- Day 6: Trace raw material to WIP, finished goods, COGS, and product sales.
- Day 7: Create a one-page cost-data map with source, owner, refresh frequency, and known gaps.
Do not worry if the first map exposes missing fields or inconsistent names. That is useful evidence, because reliable costing starts with knowing which input is incomplete. For a second structured practice case, use our costing crash course.
Week 2: Build Overhead Allocation Logic You Can Defend
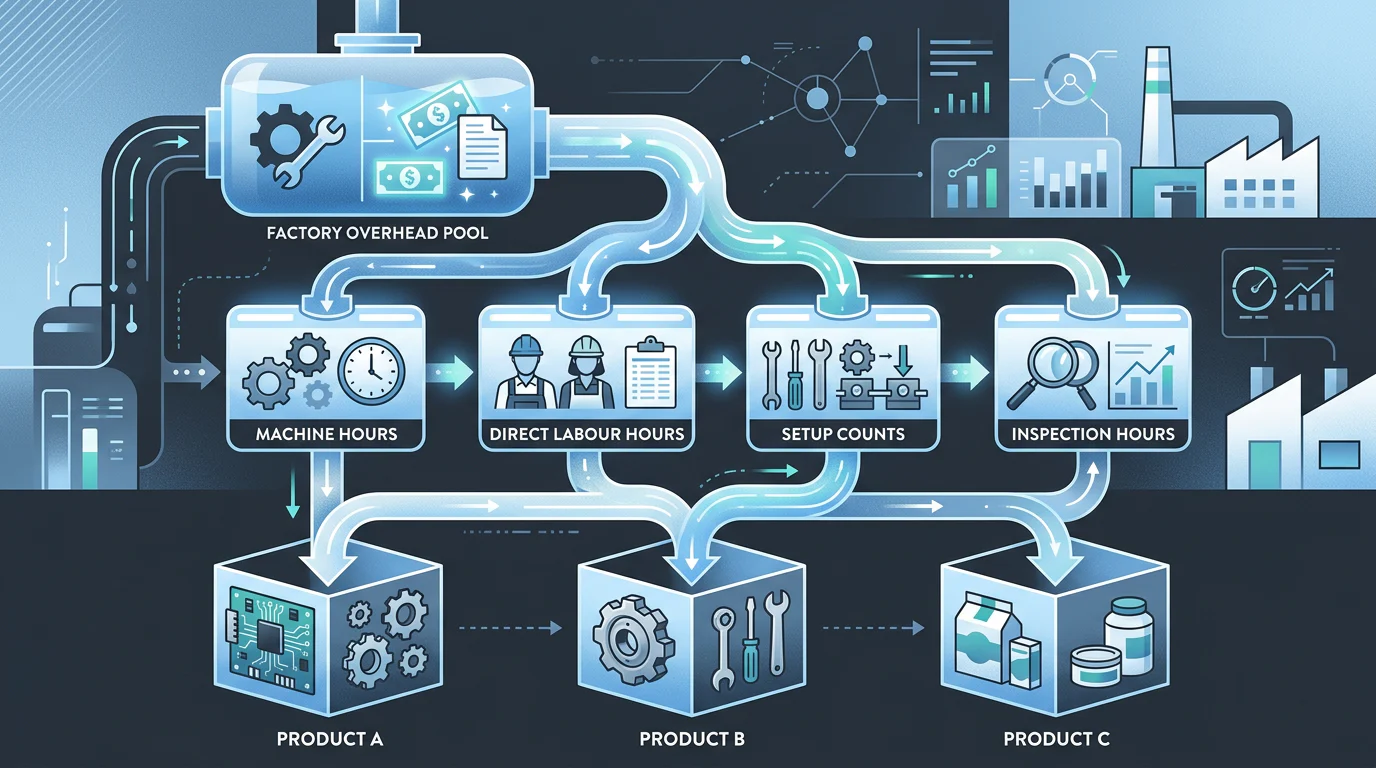
Overhead is where an apparently profitable SKU can become misleading. The goal is not to create a complicated allocation system. It is to select a driver that reflects how the product actually consumes the resource, document the choice, and revisit it when the process changes.
A cost standard identifies machine hours for machine-dependent production, direct employee hours for labour-intensive conversion, and supports multiple drivers where feasible. Use that principle as a test: if a product barely uses a resource, it should not absorb a large share of that resource’s cost.
Days 8 to 9: Create Cost Pools
List the costs that support production but cannot be traced cleanly to one unit. Typical pools include maintenance, quality, utilities, material handling, production supervision, setups, and plant administration.
Then classify each pool as fixed, variable, or mixed. A mixed pool deserves attention because using a single all-purpose rate can hide the operational cause of a cost movement.
Days 10 to 11: Match Each Pool to a Driver
Build a first allocation model by calculating pool cost divided by driver volume. Use the table below as a starting point, then replace generic choices with the drivers that best fit your process.
| Cost Pool | Useful Driver | Why It May Fit | Test Before Using |
|---|---|---|---|
| Machine maintenance | Machine hours | Consumption rises with equipment use | Check whether maintenance is mostly scheduled |
| Quality inspection | Inspection hours or batches | Product complexity may drive effort | Compare simple and complex SKUs |
| Material handling | Purchase orders or material moves | Transactions create the workload | Check whether order counts are complete |
| Setup support | Number of setups | Short production runs use more setup effort | Confirm setup reporting is reliable |
Days 12 to 14: Test and Document the Result
Apply the model to one high-volume product and one low-volume or complex product. If the result changes sharply, investigate why before treating it as an error. It may reveal that the prior allocation was masking the true cost of complexity.
Finish the week with a short policy note for every pool: cost owner, selected driver, calculation, rationale, review date, and the condition that would trigger a change. If you want to connect that work to a longer career path, review our management accounting options.
Week 3: Turn Variances into Product Margin Decisions
A variance report is not a management answer until it explains what changed, why it changed, and what someone should do next. This week turns standard-versus-actual comparisons into a concise product P&L and action memo.
Days 15 to 16: Freeze a Comparable Standard
Set a dated standard cost for direct material, direct labour, machine or resource time, and indirect cost. Record the standard’s effective date and version, because a comparison is weak when the BOM, route, or purchase price changed without being identified.
Pull actual material issues, actual labour or machine time, indirect costs, finished quantity, and sales for a completed order or batch. Keep the analysis at the same SKU, site, and period level.
Days 17 to 19: Split the Variance Before Explaining It
Calculate material price and usage variances first. Then calculate labour rate and efficiency variances, followed by variable-overhead rate and efficiency variances. Rank findings by currency impact, not percentage alone.
Official ERP guidance identifies practical causes including changed BOM or route versions, over-issued materials, and incorrectly reported operation time. These checks help you validate the production record before assigning a cause to procurement, operations, or finance.
Days 20 to 21: Build the Product P&L
Create a product-level view that shows net sales, COGS, gross margin, variable selling costs, contribution margin, attributable fixed costs, and operating contribution. Then write three lines for management: the largest movement, the likely driver, and the decision or owner required.
This is the point where a finance professional becomes useful beyond reporting. A good variance explanation may prompt a purchase-price review, an engineering change check, a setup reduction project, or a pricing conversation. Build your ability to present that conclusion with our career ROI framework.
Week 4: Make the Process Repeatable in Excel
The final nine days turn your one-product case into a monthly routine. A workbook cannot repair weak master data, but it can make uncertainty visible and give managers a repeatable way to ask better questions.
- Day 22: Populate a standard-cost sheet from the Week 1 cost-data map.
- Day 23: Add date, site, BOM version, route version, and source controls.
- Day 24: Import actual production-order or batch data.
- Day 25: Refresh a variance dashboard and rank material findings by currency impact.
- Day 26: Build a prior-period-to-current-period margin bridge.
- Day 27: Draft a management pack with issue, driver, owner, action, and due date.
- Day 28: Validate root causes with procurement or operations.
- Day 29: Assign monthly refresh and review ownership.
- Day 30: Present the product cost story and a practical 30, 60, and 90-day backlog.
Keep the first version simple enough to refresh. A consistent monthly analysis builds confidence faster than an impressive workbook that cannot survive the next close. If you are balancing career development with a full-time role, our working-professional study options can help you consider a realistic next step.
Use Excel Templates to Explain Product Margin
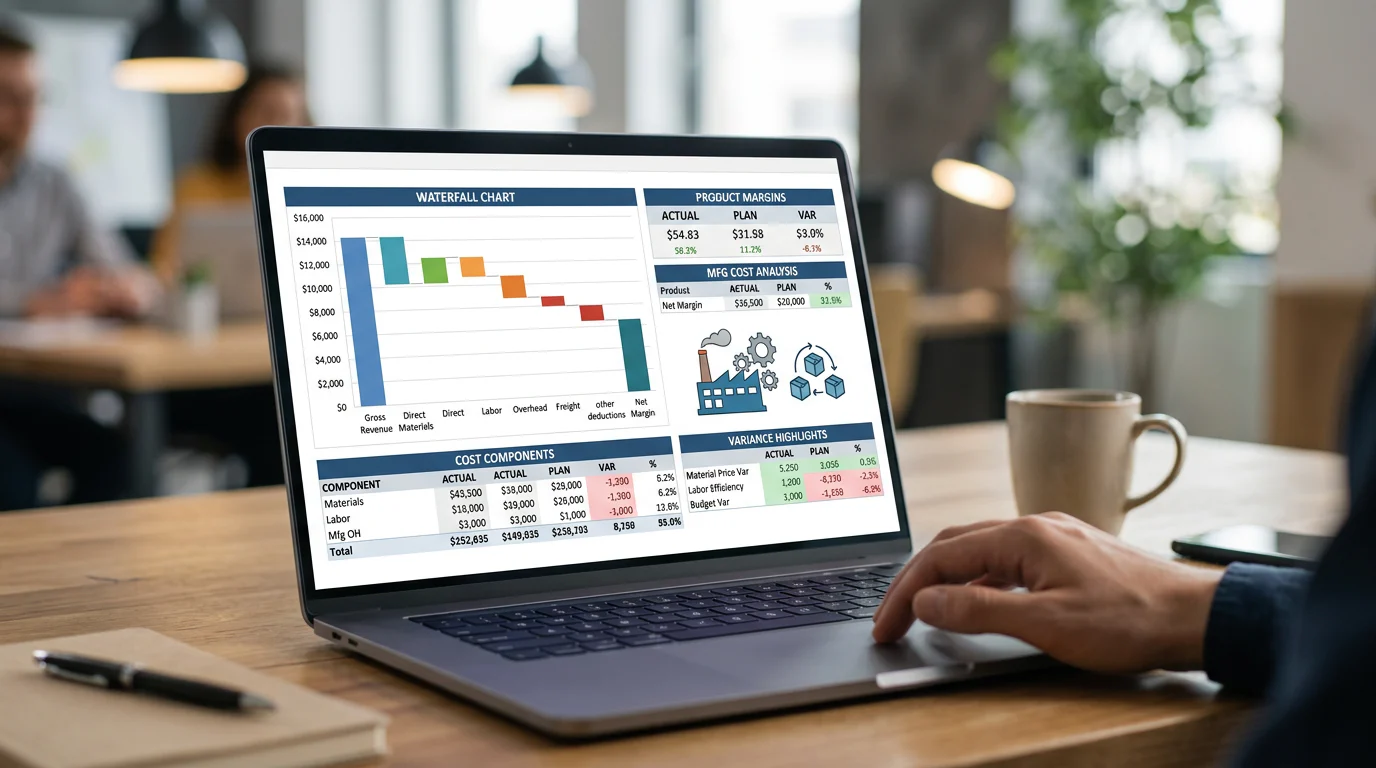
Your three most useful templates are a standard-cost builder, an actual-versus-standard variance analyzer, and a product-margin waterfall. Together, they connect source data to the decision that management wants to make.
A standard-cost builder should include BOM quantity, scrap, material price, labour or machine rate, overhead driver, driver rate, unit cost, effective date, and source reference. The variance analyzer should add actual quantities and rates, favourable or unfavourable flags, root-cause categories, and action owners.
OpenStax explains contribution margin as sales less variable costs, which makes it useful for pricing, volume, and capacity decisions. It is different from gross margin and operating margin, so your template should show all three rather than treating them as interchangeable.
| Measure | Formula | Best Question It Answers | Common Misuse |
|---|---|---|---|
| Gross Margin | Net sales less COGS, divided by net sales | Is manufacturing cost consuming more of sales? | Treating it as full business profitability |
| Contribution Margin | Net sales less variable costs, divided by net sales | Does another unit contribute toward fixed cost and profit? | Ignoring fixed-cost or capacity effects |
| Operating Margin | Operating income divided by net sales | How profitable are normal operations overall? | Applying it directly to one SKU without attribution logic |
Use a margin waterfall to show management how price, material, labour, overhead, mix, and volume moved the result. It is easier to discuss a decision when every movement has a labelled driver and an accountable owner. For a structured self-check before pursuing a qualification, try our CMA USA readiness assessment.
Build This Skill with iProledge
At iProledge, we help finance learners turn management-accounting theory into work they can defend in a review meeting. This 30-day plan gives you a practical starting point, but progress accelerates when an experienced mentor can test your assumptions, correct an allocation model, and ask the question behind an unexplained variance. Our learning support is built for people who need concepts connected to decisions, not memorised in isolation. Bring a real BOM, a production-order extract, or a product P&L, then use the framework here to structure the discussion. We can help you identify the next capability to build, whether that is costing logic, Excel analysis, reporting confidence, or a longer professional pathway. You leave with a clearer story for management and a repeatable method for the next month, not simply a completed spreadsheet that continues to improve with each close. Explore iProledge
FAQs on Manufacturing Cost Tracking and Margin Analysis
What Skills Are Missing When Product Costs Are Unclear?
Most people need four connected skills: reliable cost visibility, defensible allocation logic, variance interpretation, and margin decision-making. The weeks build them in that sequence through a real SKU.
What Are the Best Cost Drivers for Overhead?
Choose a driver that best reflects resource consumption: machine hours, labour hours, setups, inspections, material moves, or purchase orders. Test it against simple and complex products first.
How Should I Approach Variance Analysis?
Start with the largest currency impact, separate price or rate from usage or efficiency, validate the underlying transaction, then assign a root cause, owner, and action.
Where Can I Find Product Cost Data in an ERP?
Look for BOMs, routings, cost versions, purchase prices, material issues, operation time, indirect costs, WIP movements, finished-goods receipts, and product-level sales data for the selected SKU.
How Can I Keep Building These Skills After Thirty Days?
Repeat the monthly SKU review, add a product family, and use our guide to strengthen reporting, analysis, communication, and decision-support capabilities for future management reviews.